More savings slip away when usage shifts
Workloads shift and discount options change. If you’re manually managing your commitments you may struggle to keep pace, which is why even the most well-run teams often only sit at just 10–15% effective savings and may face the following challenges:
- Your reserved instance (RI) or savings plan (SP) utilization is below 90%
- You can't tell which commitments are working and which are wasting budget
- Your team spends hours monthly reviewing commitment positions manually
- You've never benchmarked your savings rate against industry peers
More savings from the commitments you’re already paying for
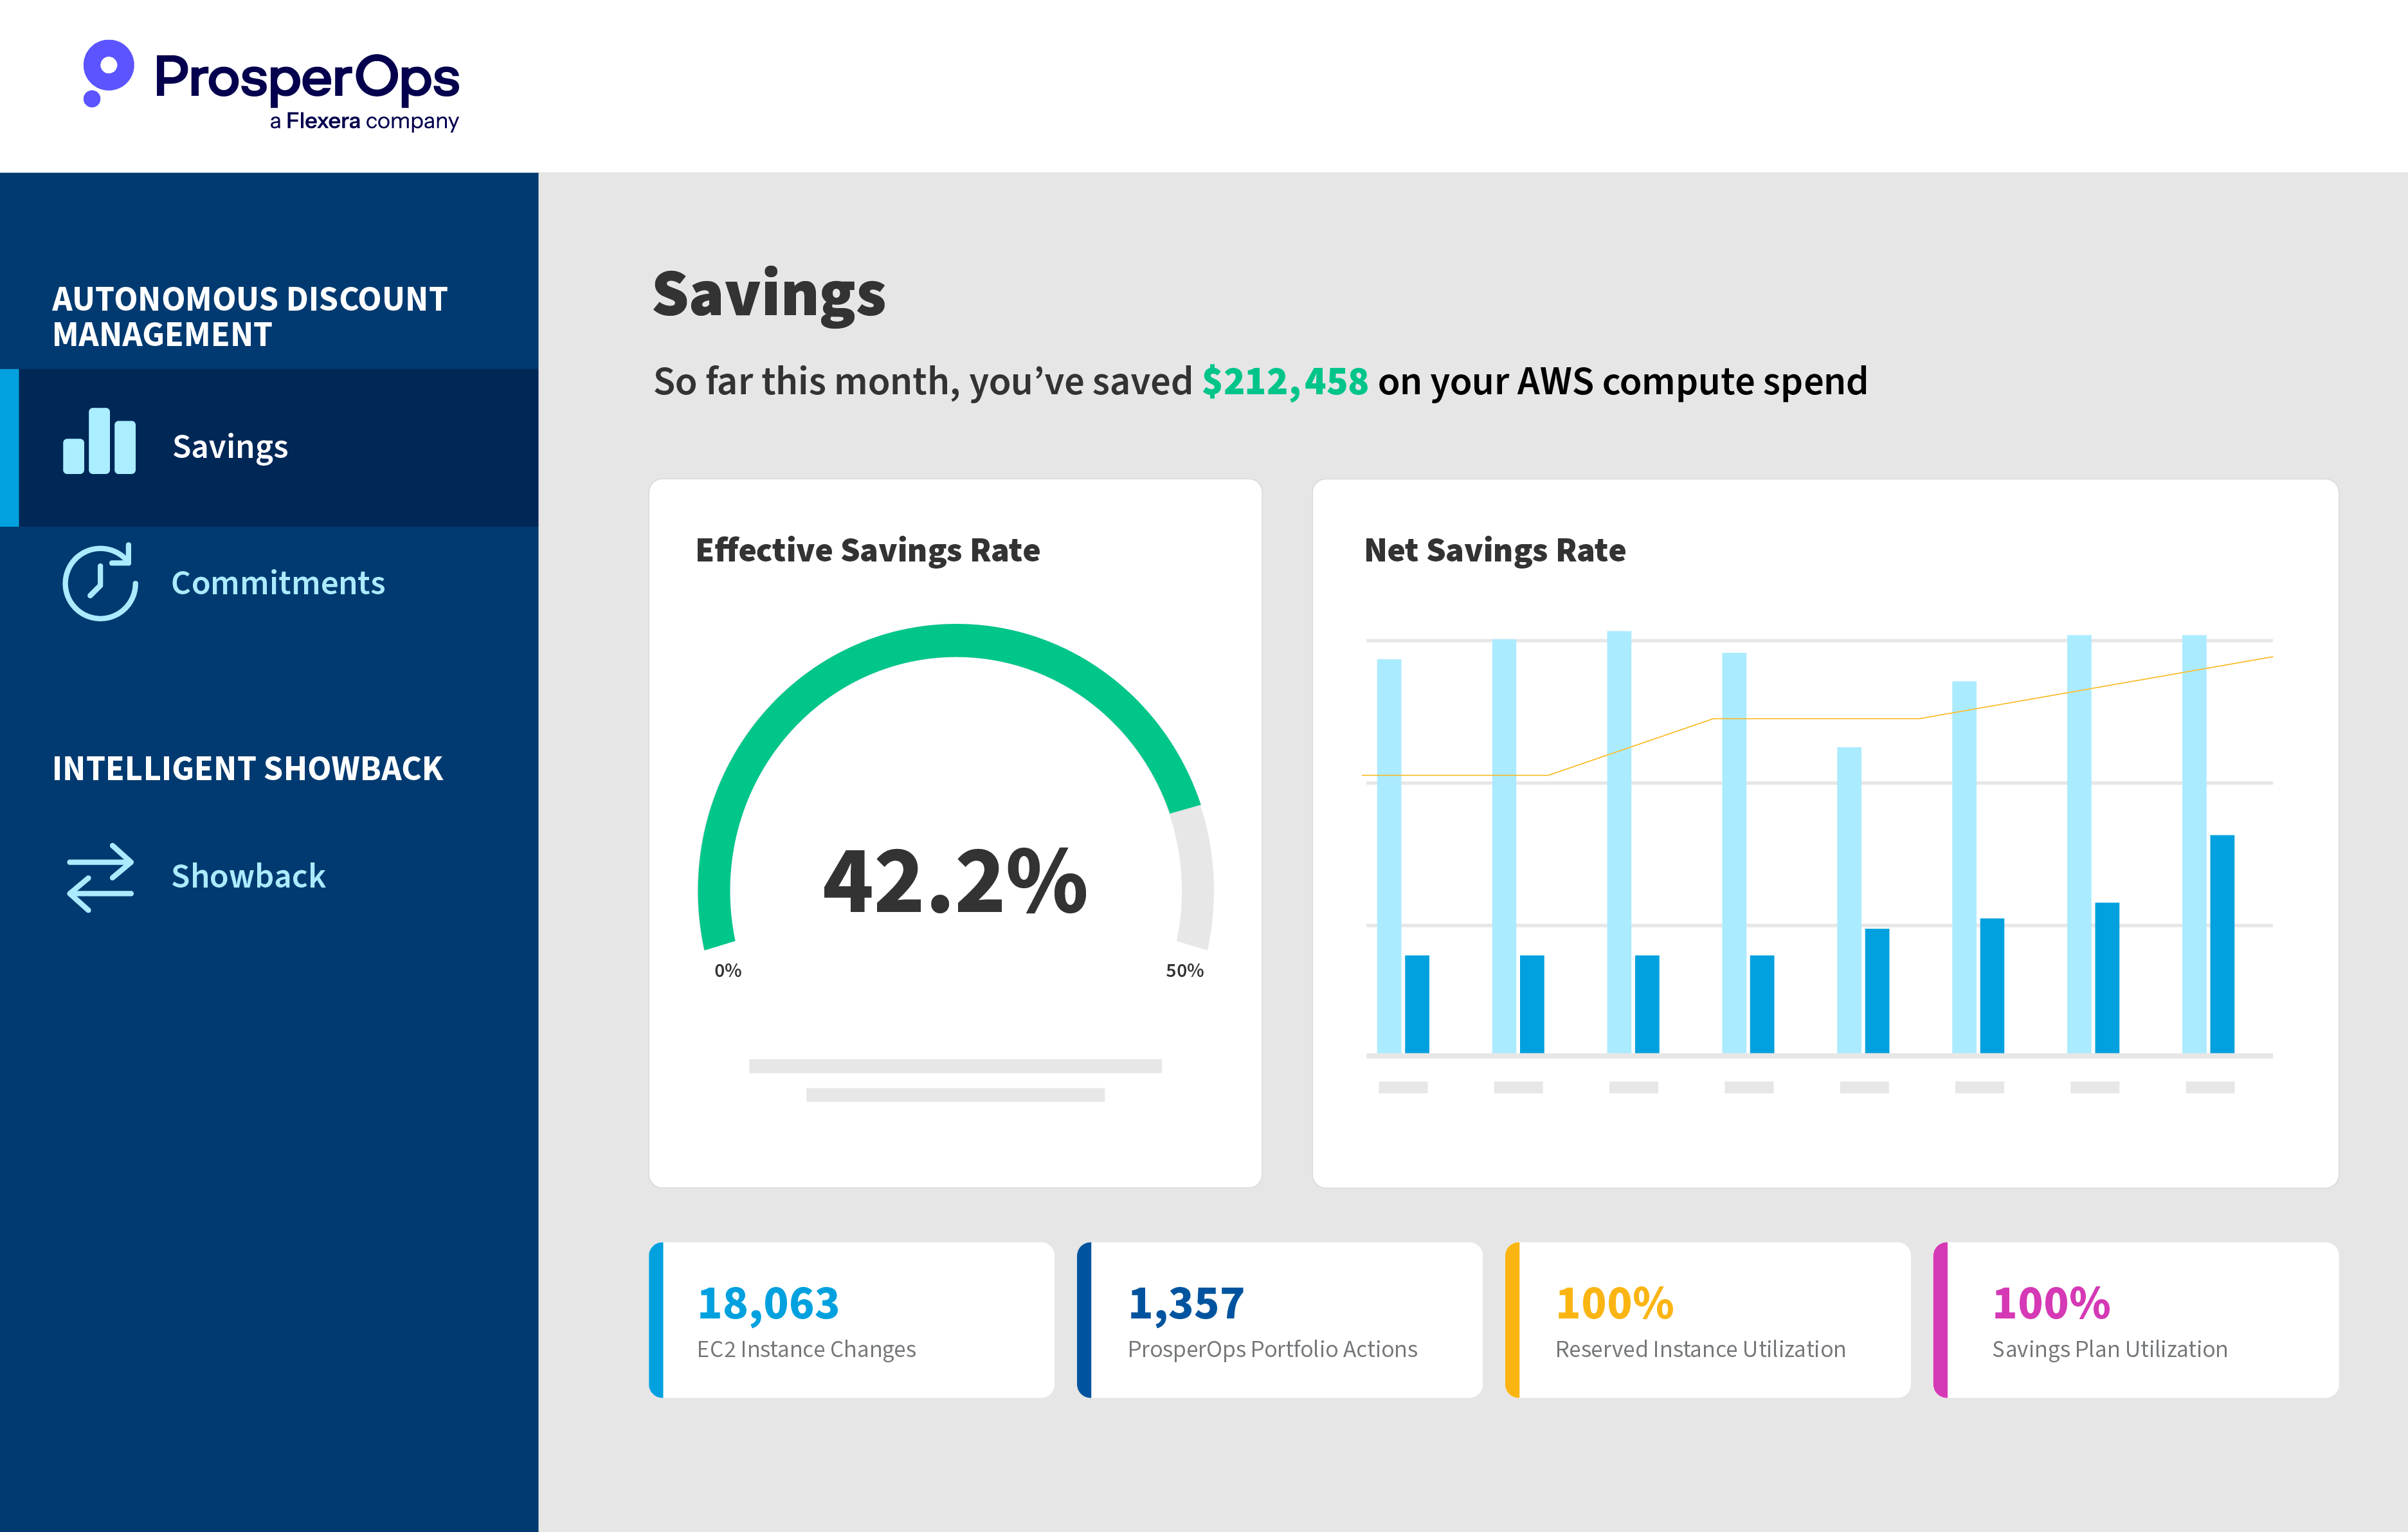
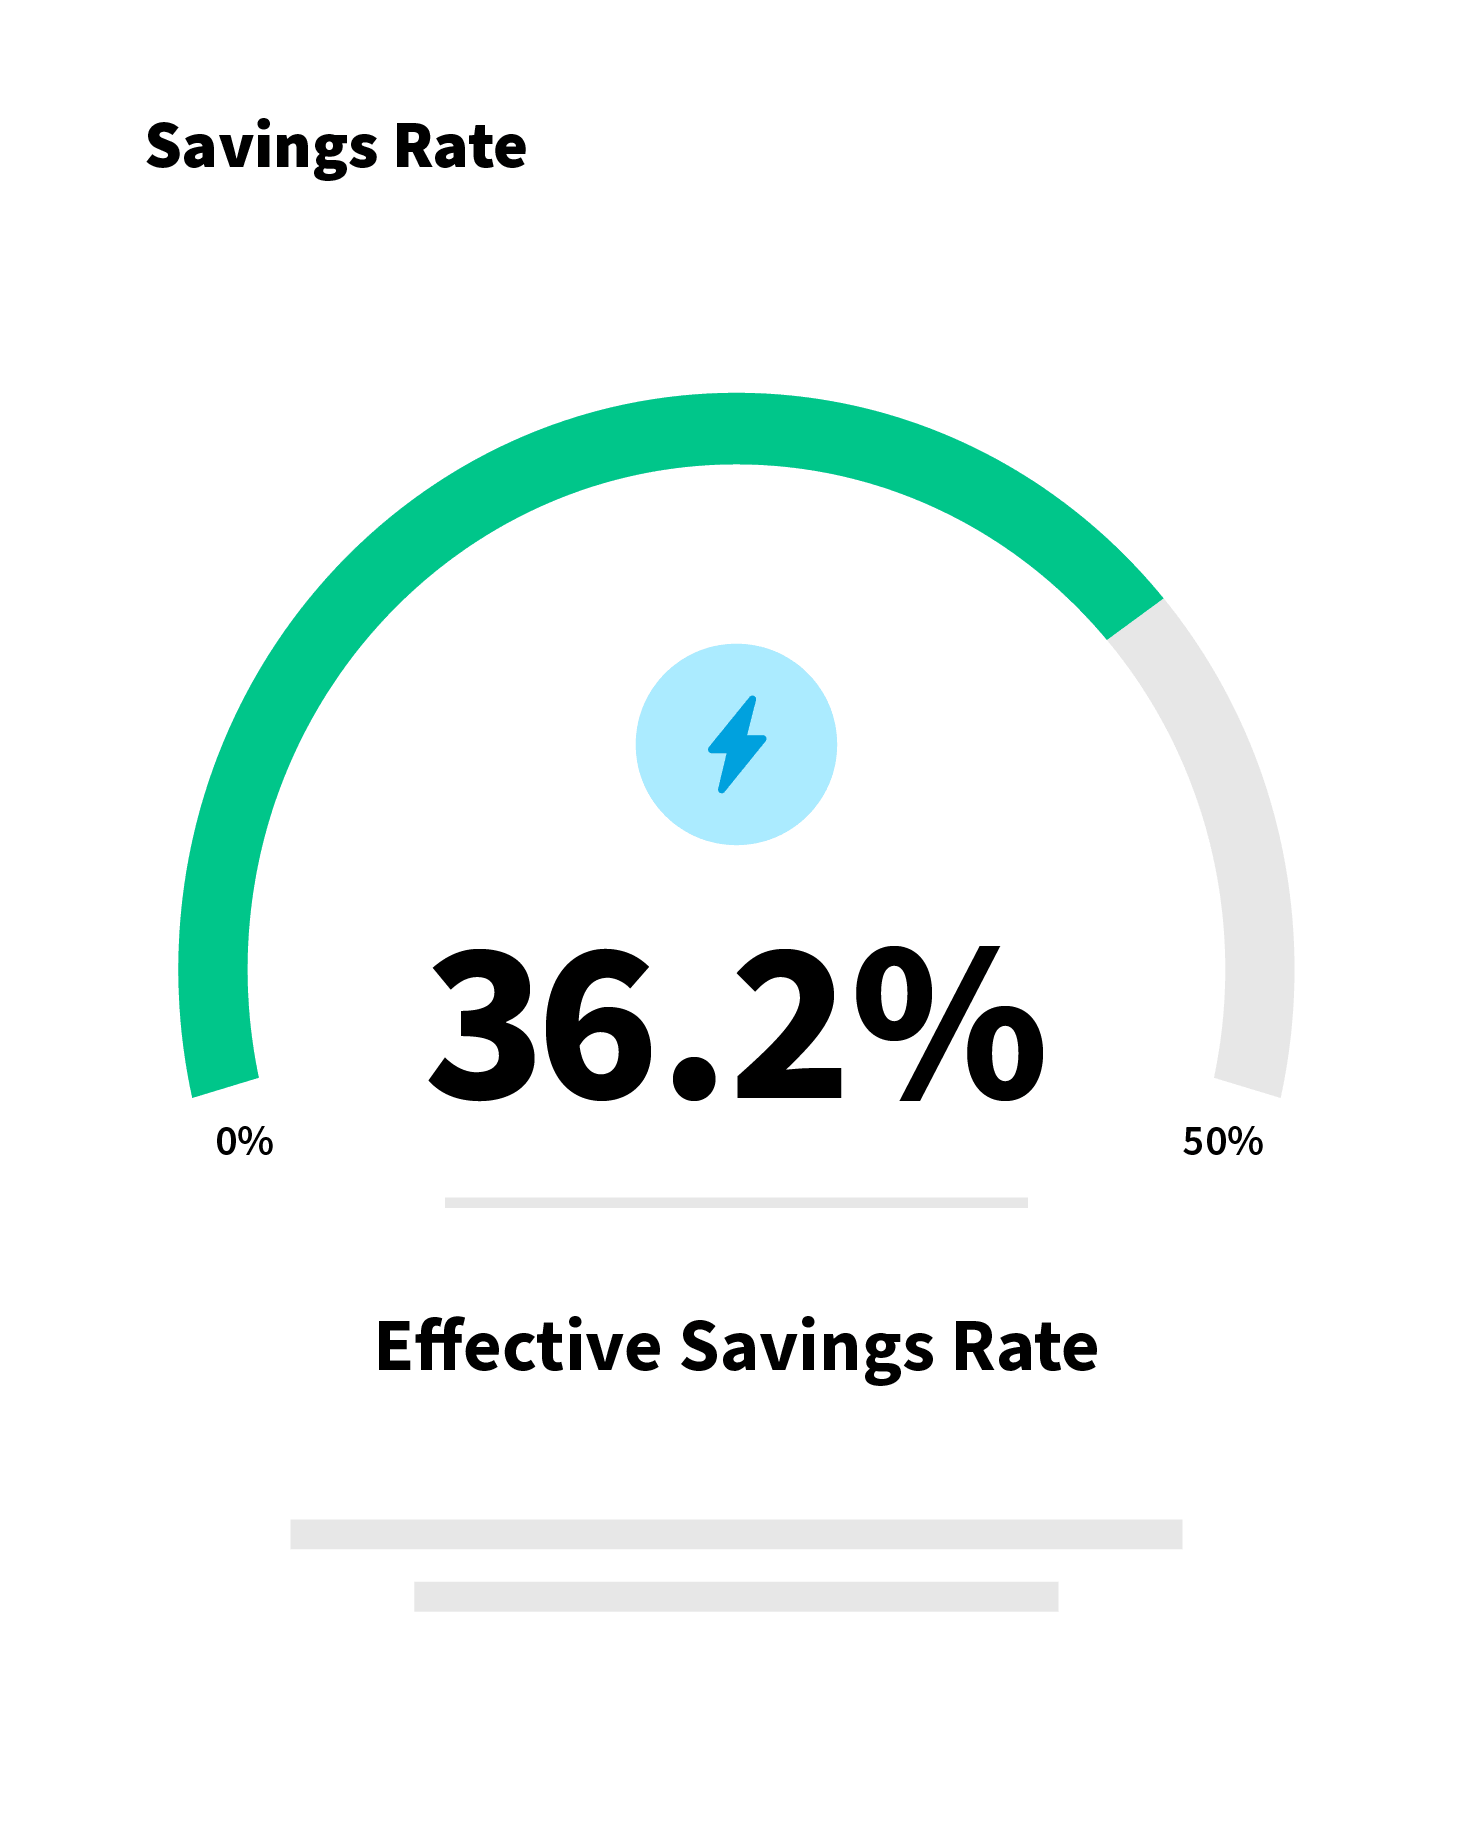
1. Benchmark your effective savings rate
Compare your commitment efficiency across AWS, Azure and Google Cloud to typical outcomes and see exactly how large the gap is and what closing it is worth in dollars.
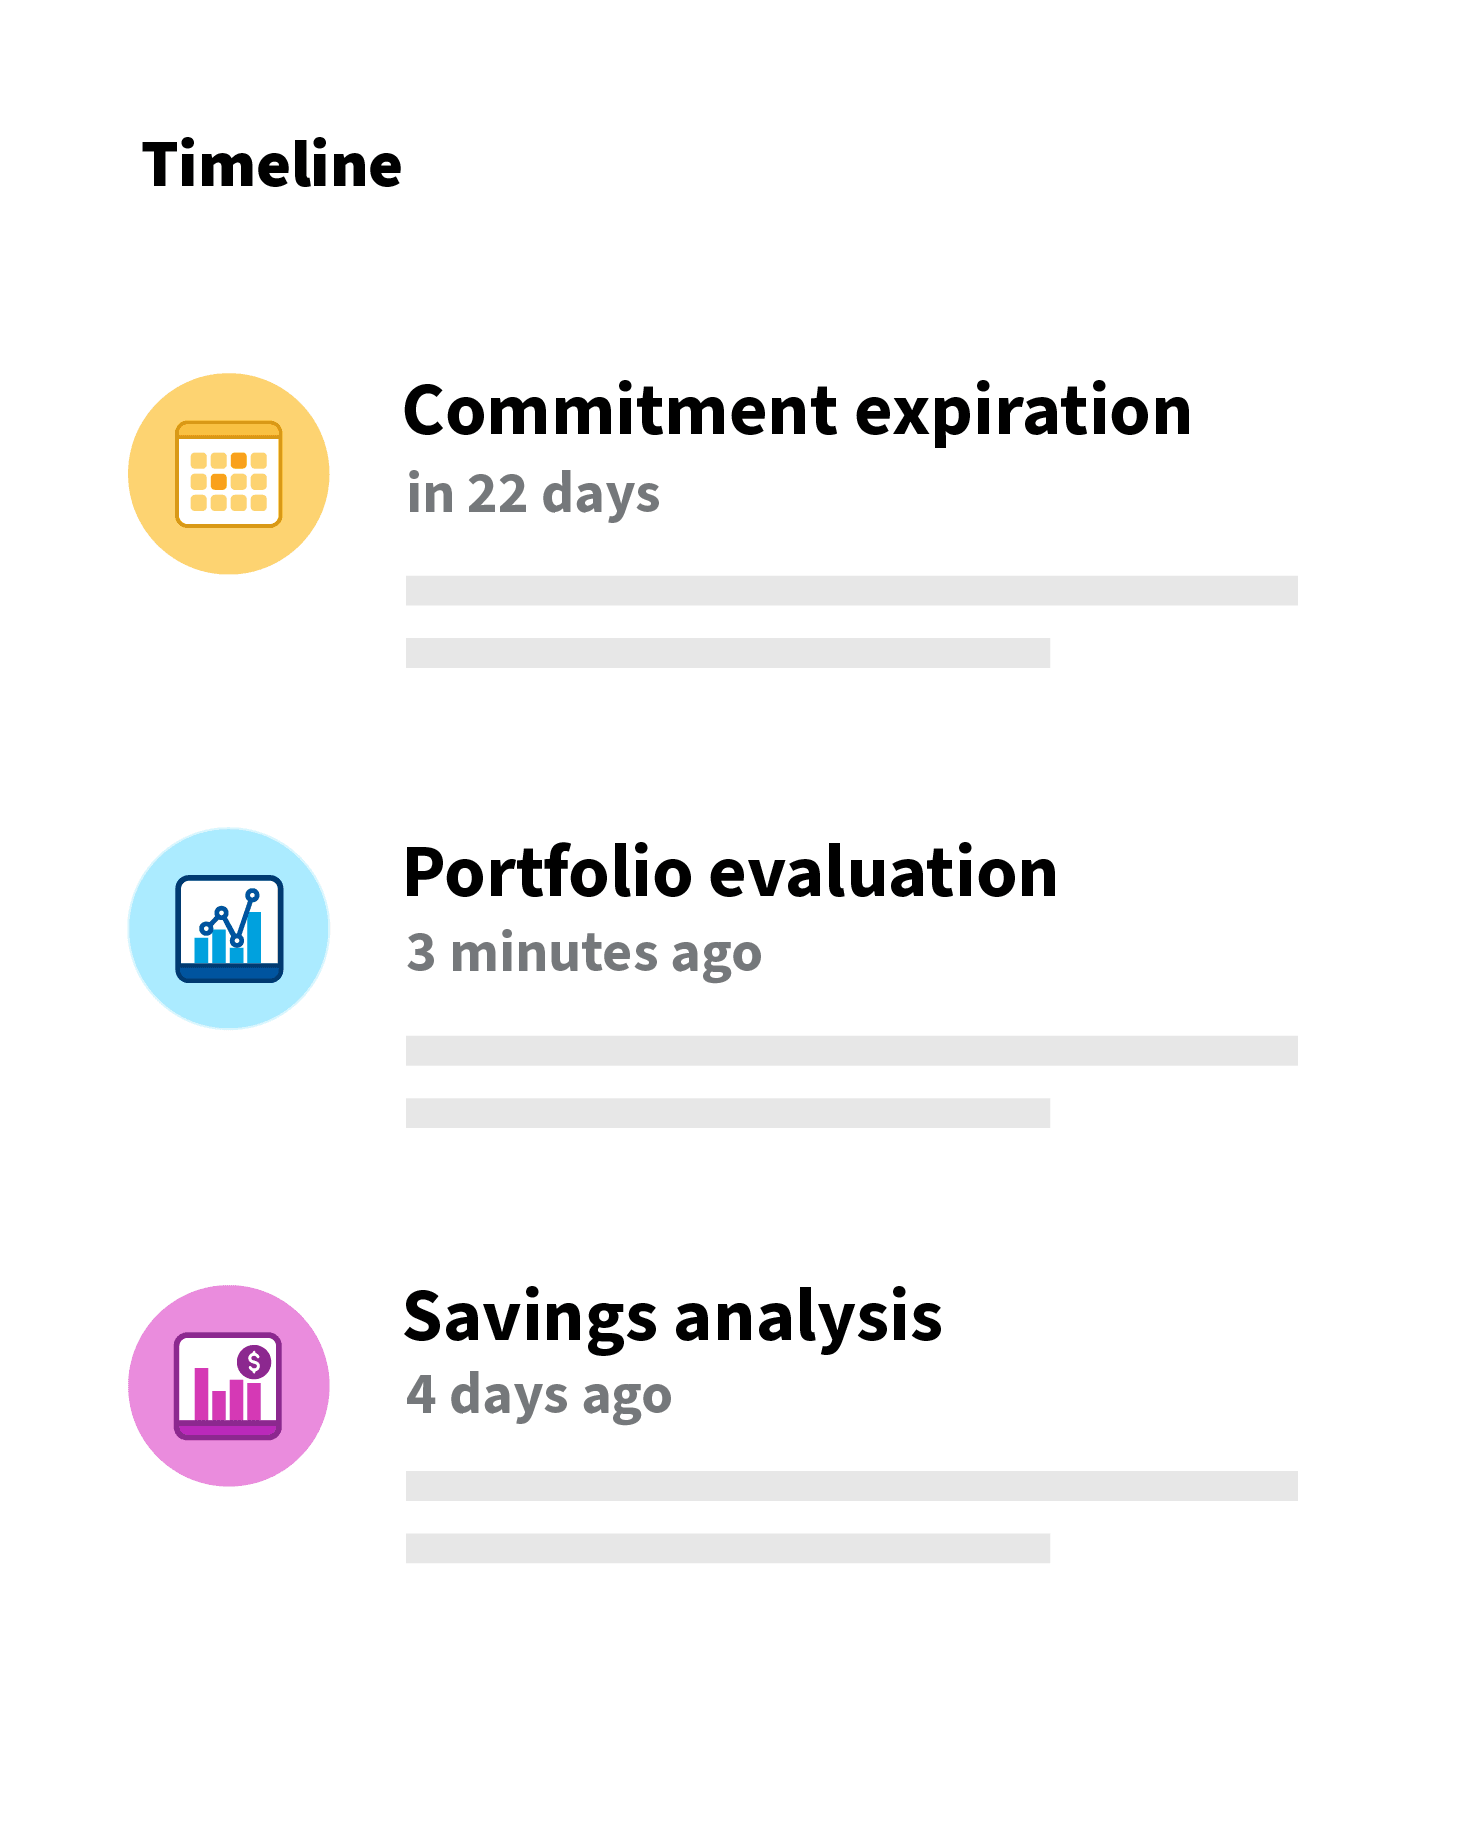
2. Visualize commitment gaps and overexposure
Get a clear view of uncovered spend, underutilized reservations and lock-in risk across SPs, RIs and committed use discounts (CUDs) across every cloud, in one place.
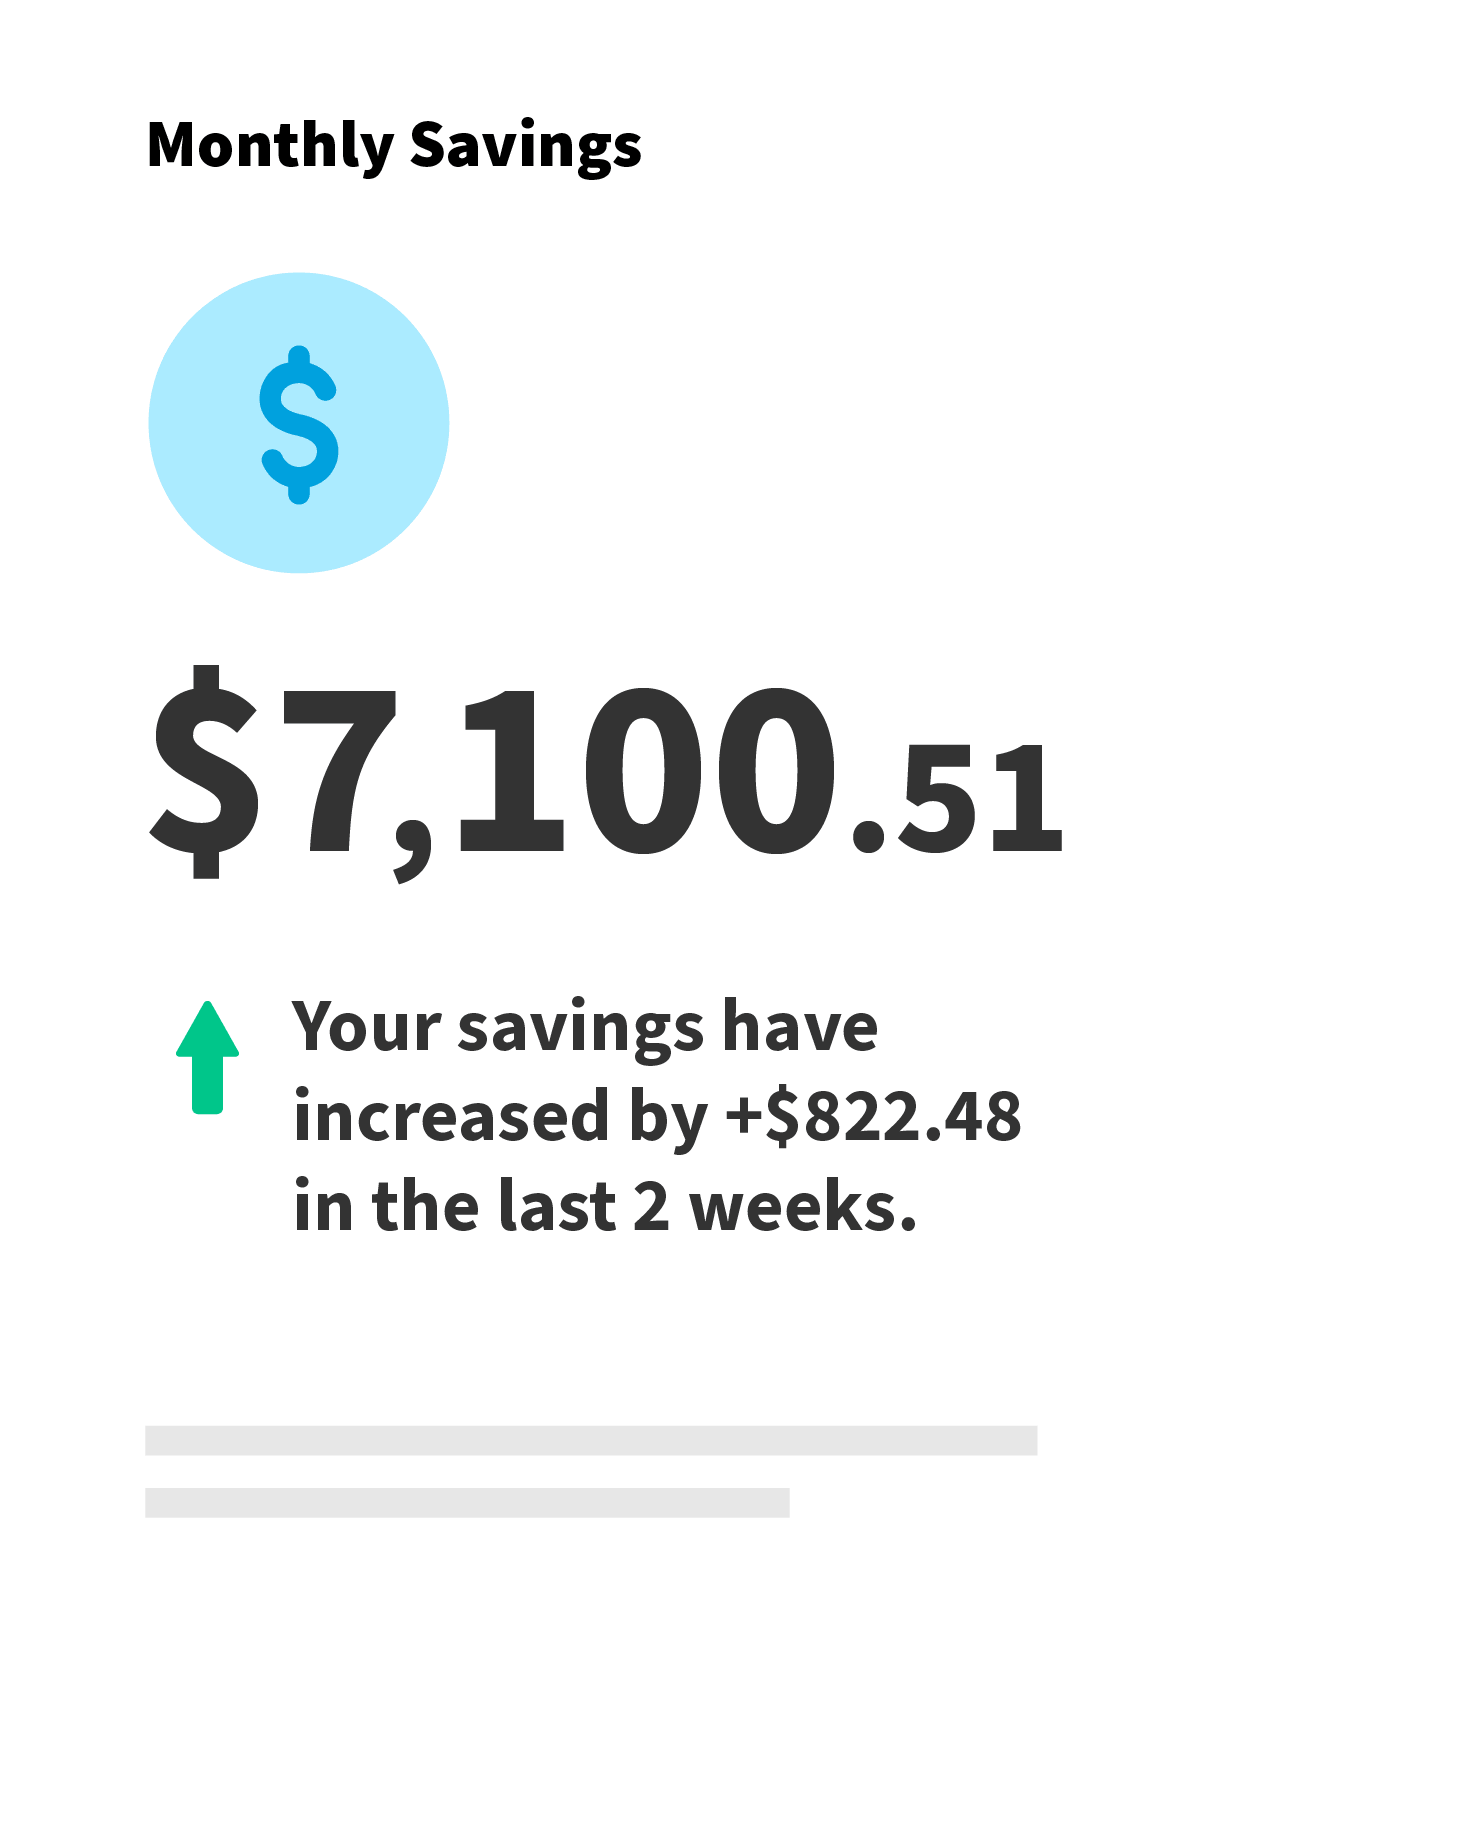
3. Quantify your real savings potential
Walk away with a concrete savings number and prioritized next steps, reviewed with a FinOps certified expert.
Trusted by FinOps teams worldwide
Three out of four customers see at least a 50% increase in effective savings after their analysis. Across AWS, Azure and Google Cloud, the gap between manual results and what’s possible is rarely small.
As a relatively sophisticated user of AWS, we were already well over 90% coverage from RIs and SPs before we started working with ProsperOps. With ProsperOps, we’ve managed to cut our EC2 costs by almost 20% more and significantly reduce DevOps overhead at the same time.

Truly a set-and-save solution. Not only did our Effective Savings Rate increase significantly, but the time we spend managing commitments has been reduced substantially.
Other platforms just make recommendations. This platform takes action—we set parameters for coverage and risk, and it executes with the best financial instruments available.
More discount coverage—from the commitments you already have
You’ll get a clear view of how your cloud discounts are performing today, based on your actual usage data. That includes your effective savings rate, where commitment coverage is strong or slipping and how much savings potential is realistically available in your environment. No estimates. No guesswork.
- See discount coverage and utilization over time
- Identify underused commitments and uncovered spend
- Leave with a prioritized next step plan, reviewed with a FinOps certified expert
3 out of 4 customers see at least a 50% increase in savings
How it works

Get a free cloud savings analysis
10-minute setup • Least-privilege read-only access • Review results with a FinOps certified expert
FAQs
Is the analysis really free?
Yes. The cloud savings analysis is free, and you don’t need to purchase anything to get it.
What exactly does the analysis cover?
SPs, RIs and CUDs across AWS, Azure and Google Cloud, including discount coverage and utilization signals.
What access do you need?
Least-privilege access to your payer or billing account so the analysis can use real cost and usage data.
How long does setup take?
Most teams can grant access in about five minutes and complete setup in about ten minutes.
Who reviews my analysis with me?
A FinOps certified expert from Flexera personally walks through the findings with you. You get real answers, not a sales pitch.
We already manage our own commitments—why bother?
Even sophisticated teams managing RIs and SPs manually typically sit at 10–15% effective savings. Our customers average around 40%. The analysis tells you precisely where your strategy is working—and where it isn’t.