2026
How ITAM teams are navigating
Proper ITAM remains foundational to managing today’s increasingly complex and expansive IT environments. The scope of ITAM continues to expand as organizations balance on-premises infrastructure with SaaS, public cloud and new AI-driven software. From this expansion a new question has emerged: Who should be responsible for cloud‑based ITAM—FinOps teams or traditional ITAM teams? The Flexera 2026 State of ITAM Report explores how ITAM programs are adapting, where responsibilities are shifting and how collaboration across FinOps, cloud, security and procurement teams is reshaping the function.
Based on a global survey of ITAM, SAM and FinOps professionals, the report highlights both progress and pressure points. While visibility, optimization and cross-team alignment are improving in several areas, rising AI adoption, ongoing audit exposure and growing software complexity continue to challenge organizations of all sizes. The findings that follow offer a snapshot of how ITAM teams are prioritizing their efforts today and where they’ll need to focus next to reduce risk, control costs and drive greater business value from their technology investments.
Report highlights
Here’s a sample of key findings from this year’s report, representing trends in ITAM based on a worldwide survey of 512 professionals performing IT asset management functions.
How are you measuring AI spend?

N=512
Source: Flexera 2026 State of ITAM Report
![]()
![]()
At least half of all organizations are tracking AI spend as part of their software spend.
Have you received notice or have you received a software audit in the last year?

N=512
Source: Flexera 2026 State of ITAM Report
![]()
![]()
Nearly half (48%) of companies have been audited in the last year.
What are the top 3 SAM initiatives you want to advance in the next year?

N=512
Source: Flexera 2026 State of ITAM Report
![]()
![]()
Optimizing software spend is the most important initiative that SAM teams want to advance in the next year.
Do you have accurate visibility into the following environments within your IT estate?

N=512
Source: Flexera 2026 State of ITAM Report
![]()
![]()
ITAM teams are struggling to get visibility into AI software and BYOL.
Table of contents
Key findings
ITAM is becoming more strategic as it converges with FinOps and cloud
ITAM continues to move closer to cloud and FinOps teams as its strategic scope grows. This year, ITAM teams reporting directly to CIOs or CTOs declined by 6 percentage points, while reporting into cloud management or FinOps increased by 5 percentage points. Nearly four in five organizations (78%) now have a dedicated FinOps team, and almost all ITAM professionals report some level of FinOps responsibility: 75% manage cloud software licenses, 64% manage SaaS licenses and 51% support AI spend visibility. At the same time, interaction between ITAM and FinOps dipped slightly year over year, signaling room for stronger alignment and clearer demarcation of responsibilities.
Roles between ITAM and FinOps continue to blur in public cloud optimization
Responsibility for generating software savings in public cloud environments is now nearly evenly split between ITAM and FinOps teams. This year, 47% of organizations report that ITAM or SAM teams are responsible for managing software savings in the public cloud, placing them within only a few percentage points of FinOps-led ownership. This near‑parity highlights how boundaries between ITAM and FinOps continue to blur, creating both opportunity and friction as teams navigate shared accountability for optimization, governance and cost control in increasingly complex cloud environments.
AI is reshaping priorities faster than organizations can establish visibility
AI is reshaping ITAM priorities, but visibility remains limited. Tracking or adopting new AI applications is now the top combined challenge overall, cited by 84% of respondents. While nearly half of organizations (47%) plan to significantly increase their focus on AI software in the coming years, only 31% report having visibility into AI software today. More than half of ITAM teams already support AI- related responsibilities, and 59% of organizations say wasted AI spend increased year over year, which reflects rapid experimentation without mature governance.
Cost optimization leads as audit activity and spend pressure persist
Optimizing software spend remains the top SAM priority, widening its lead over all other initiatives by more than 19 percentage points— the largest gap seen since the survey began five years ago. While overall wasted spend declined or held steady across much of the IT estate, audit activity remains high. Nearly half of organizations (48%) received a software audit in the past year, with Microsoft audits reported by 64% of those respondents. Over the past three years, 44% of organizations spent more than $1 million on audits, underscoring the effects of the complexity of software use rights continuing to be a top ITAM challenge.
Speak with an expertMethodology
The Flexera State of ITAM survey tapped 512 professionals with IT asset management responsibilities worldwide in early 2026. The network includes professionals across industries and context areas.
Flexera sources participants from an independent panel that’s rigorously maintained and is comprised of vetted respondents with detailed profiles. All numbers and percentages are rounded to the nearest whole number.
Reuse
We encourage the reuse of data, charts and text published in this report under the terms of this Creative Commons Attribution 4.0 International License. You’re free to share and make commercial use of this work as long as you provide attribution to the Flexera 2026 State of ITAM Report as stipulated in the terms of the license.
Commonly used terms:
BYOL: Bring your own license
CCOE: Cloud center of excellence
CMDB: Configuration management database
EOL/EOS: End of life/end of service
ESG: Environmental, social and governance
FTE: Full-time equivalent
HAM: Hardware asset management
IaaS: Infrastructure as a service
ITAD: IT asset disposition
ITAM: IT asset management
ITFM: IT financial management
ITSM: IT service management
PaaS: Platform as a service
PAYG: Pay as you go
SaaS: Software as a service
SAM: Software asset management
Small organizations: Organizations with fewer than 5,000 employees
Medium organizations: Organizations with between 5,000-20,000 employees
Large organizations: Organizations with more than 20,000 employees
ITAM is a critical and strategic function—and it’s evolving
This year, we’ve observed a notable shift: ITAM teams reporting directly to CIOs or CTOs dropped by 6 percentage points, while those aligning with cloud management or FinOps saw a 5-point increase. This shift reflects closer structural alignment between ITAM and FinOps as responsibilities evolve. While reporting alignment increased, day-to-day interaction dipped slightly year over year, suggesting that as roles become clearer, collaboration is becoming more targeted rather than constant.
Most organizations (78%) now have a dedicated FinOps team. Regardless of an organization’s size, more than half of respondents say they regularly engage with these teams. However, compared to last year, there’s been a noticeable drop in ITAM and FinOps interaction overall—but when looking at the relationship between FinOps and ITAM teams, the good news is roughly half of respondents report directly to the same manager or VP/director, regardless of organizational size. To achieve comprehensive visibility and drive IT optimization, it’s vital for these groups to work closely together. Having both report to the same leaders could make collaboration easier and more effective.
78% of organizations have a dedicated FinOps team
Where does your ITAM team report?

N=512
Source: Flexera 2026 State of ITAM Report
(Figure 1)
![]()
![]()
Does your organization have a FinOps team?

N=512
Source: Flexera 2026 State of ITAM Report
(Figure 2)
![]()
![]()
Interaction between ITAM and FinOps teams

2026: N=512; 2025: N=506
Source: Flexera 2026 State of ITAM Report
(Figure 3)
![]()
![]()
Understanding the ITAM and FinOps teams’ relationship

Small: N=108; Medium: N=244; Large: N=160
Source: Flexera 2026 State of ITAM Report
(Figure 4)
![]()
![]()
Is your team upskilling for FinOps?

N=175
Source: Flexera 2026 State of ITAM Report
(Figure 5)
![]()
![]()
ITAM and FinOps continue to converge, with 92% of ITAM team members reporting they’re upskilling for FinOps—an encouraging signal for the future of cross-functional cost management.
Which of the following teams does your SAM team have significant interaction with?

N=512
Source: Flexera 2026 State of ITAM Report
(Figure 6)
![]()
![]()
For SAM teams, C-suite interaction decreased by 5 percentage points year over year. Over the same period, interaction with cloud teams increased by 10 percentage points year over year—and by 13 percentage points since 2024—further reinforcing ITAM’s growing collaboration with cloud teams.
ITAM/SAM teams responsible for generating software savings in public cloud environments decreased by 12 percentage points
Which team is responsible for generating software savings in public cloud environments?

2025: N=506; 2026: N=512
Source: Flexera 2026 State of ITAM Report
(Figure 7)
![]()
![]()
Year over year, we’re seeing a notable shift in which teams are accountable for generating software savings in public cloud environments. Organizations reported that ITAM teams are responsible for generating software savings in public cloud environments just 1 percentage point more often than FinOps teams. Last year, 59% of organizations reported this was managed through ITAM/SAM teams with 32% reporting management through FinOps teams.
ITAM challenges
As ITAM responsibilities expand, teams are also facing growing operational and organizational challenges—many tied directly to new environments, rising complexity and limited resources. Year over year, the largest enterprises report fewer FTEs dedicated to HAM and SAM activities. In contrast, medium and large enterprises show an increase in ITAM staffing. Staffing levels for smaller organizations remain roughly unchanged.
Number of FTEs devoted to HAM and SAM activities (global results)

N=512
Source: Flexera 2026 State of ITAM Report
(Figure 8)
![]()
![]()
Which statement best describes where you are in implementing SAM in your organization?

N=512
Source: Flexera 2026 State of ITAM Report
(Figure 9)
![]()
![]()
Take our ITAM assessment to see how advanced your ITAM practices are
Get startedThis year’s results indicate a clear maturation of SAM programs, with more organizations taking on more intermediate SAM responsibilities and fewer reporting beginner-level SAM responsibilities. At the same time, ITAM continues to gain traction as organizations look to reduce software waste and improve cost controls. Looking ahead, it will be important to watch how SAM programs evolve as AI software tracking and optimization become a more common requirement.
For ITAM teams’ SAM-focused responsibilities, maintaining an accurate inventory (78%) is the top priority, underscoring how foundational clean, enriched data remains. This year’s results reinforce that theme across multiple areas. For example, among advanced users, reclaiming unused software increased from 59% to 79% year over year. Tracking SaaS and public cloud software also continues to trend upward, and tracking the use of AI software is the top planned responsibility (47%).
Maturity continues to shape focus areas. Mature organizations tend to prioritize what’s in use and cloud software optimization, while less mature organizations are still building the foundational program elements. Tracking the use of software licenses in public cloud increased across all organization sizes year over year (from 52% to 53% for beginners; 60% to 65% for intermediate users; 62% to 75% for advanced users).
Among advanced users, several practices posted significant year-over-year gains:
- Tracking usage of software licenses in containers increased from 38% to 49%
- Reclaiming unused software increased from 59% to 79%
- Optimizing based on software use rights increased from 51% to 59%
- Providing data for regulation or ESG initiatives increased from 48% to 58%
78% of ITAM teams say accurate inventory is their top priority, which is essential for compliance, risk and AI automation accuracy
What SAM-focused responsibilities does your ITAM team have?

N=512
Source: Flexera 2026 State of ITAM Report
(Figure 10)
![]()
![]()
SAM responsibilities by maturity

N=512
Source: Flexera 2026 State of ITAM Report
(Figure 11)
![]()
![]()
Mid-sized organizations are more likely to include AI spend in software budgets
How are you measuring AI spend?

N=512
Source: Flexera 2026 State of ITAM Report
(Figure 12)
![]()
![]()
This year, we asked respondents how they track AI spend. Responses were similar across small and large organizations, but mid-sized organizations were most likely to include AI spend in software budgets rather than track it separately.
Do you use an MSP for any of your ITAM needs?

N=512
Source: Flexera 2026 State of ITAM Report
(Figure 13)
![]()
![]()
Enterprises with more FTEs dedicated to ITAM are also more likely to use an MSP
We also asked whether organizations use an MSP (or multiple MSPs) to support ITAM needs. Most do (75%), and larger organizations are more likely to use MSPs than smaller companies.
Organizations with more FTEs dedicated to ITAM activities are more likely to use an MSP. One explanation may be increased audit activity, which often drives targeted MSP support for license expertise, data normalization and audit defense rather than full operational ownership. We plan to revisit this relationship in next year’s report.
Join our Partner ecosystem
Get startedMSP usage by organizational size

Small: N=108; Medium: N=244; Large: N=160
Source: Flexera 2026 State of ITAM Report
(Figure 14)
![]()
![]()
ITAM teams appear to be taking on more HAM responsibility, along with FinOps teams taking on more cloud software responsibility. Across the board, reported HAM responsibilities increased year over year, with maintaining accurate inventories remaining the central theme. Lifecycle management stood out, increasing by 7 percentage points.
Which statement best describes where you are in implementing HAM in your organization?

N=512
Source: Flexera 2026 State of ITAM Report
(Figure 15)
![]()
![]()
What HAM-focused responsibilities does your ITAM team have?

N=175
Source: Flexera 2026 State of ITAM Report
(Figure 16)
![]()
![]()
75% of ITAM teams are responsible for cloud software license management
What FinOps-focused responsibilities does your ITAM team have?

N=175
Source: Flexera 2026 State of ITAM Report
(Figure 17)
![]()
![]()
Nearly all ITAM professionals report at least some responsibilities related to FinOps, with only 3% reporting none. Three-quarters are responsible for cloud software licenses, and 64% are responsible for SaaS licenses. More than half (51%) are responsible for AI spend visibility.
Findings for SAM team responsibilities are largely consistent with last year, with one notable addition: tracking the use of AI software. Fifty-two percent of ITAM teams that report to the CTO or CIO are tracking AI usage. That rate is higher when ITAM reports to cybersecurity teams (58%), while ITAM teams that report into FinOps track AI software less than the average (41%).
HAM team responsibilities and reporting lines are also similar year over year. However, security teams show notable increases across most categories.
58% of SAM teams that report into cybersecurity track AI usage
SAM team responsibilities and where they report

N=512
Source: Flexera 2026 State of ITAM Report
(Figure 18)
![]()
![]()
HAM team responsibilities and where they report

N=512
Source: Flexera 2026 State of ITAM Report
(Figure 19)
![]()
![]()
What do your hardware sustainability policies include?

N=512
Source: Flexera 2026 State of ITAM Report
(Figure 20)
![]()
![]()
For the second year in a row, sustainability processes increased across the board, with the exception of a statistically insignificant change in longer retention periods. Overall, sustainability policies continue to gain momentum across organizations.
65% of organizations recycle as part of their hardware sustainability policies
What’s your estimated wasted spend across your IT estate?

N=512
Source: Flexera 2026 State of ITAM Report
(Figure 21)
![]()
![]()
ITAM‑identified wasted spend declined or held steady across most areas this year. While SaaS and public cloud inefficiencies persist, these results reflect improvements in visibility and optimization within the scope of ITAM programs.
59% say wasted AI software spend has increased year over year
As AI adoption and experimentation accelerate, 59% of organizations report that wasted AI spend has increased year over year. The Flexera 2026 State of the Cloud Report highlights growing cost pressure (including 45% using GenAI in public cloud services) across cloud environments, reinforcing why ITAM teams are expanding optimization and governance efforts across software and cloud licensing.
This year’s State of ITAM survey findings point to similar pressure across the IT estate. Reported SaaS wasted spend increased by 10 percentage points, and IaaS and PaaS increased by 8 percentage points.
How do you feel wasted spend has changed in the past year?

N=512
Source: Flexera 2026 State of ITAM Report
(Figure 22)
![]()
![]()
New to the survey this year, tracking or adopting new AI applications ranks as the second-highest significant challenge and the top combined challenge overall (84% of respondents). Managing new environments is also rising as a significant challenge, up 9 percentage points year over year. As AI, SaaS and cloud continue to expand, this pressure is likely to increase and drive closer alignment between ITAM and FinOps teams.
Software vendor use rights are becoming more complex as well, up 3 percentage points year over year. By maturity level, new environments (such as SaaS, cloud and containers), tracking or adopting new AI applications and software use rights complexity are significant challenges across the board. For beginner ITAM practitioners, limited resources or a lack of SAM tools is another key obstacle, second only to use rights complexity.
What are your challenges with SAM?

N=512
Source: Flexera 2026 State of ITAM Report
(Figure 23)
![]()
![]()
SAM challenges by maturity

N=512
Source: Flexera 2026 State of ITAM Report
(Figure 24)
![]()
![]()
Top initiatives
for SAM teams
47% of respondents negotiate contract terms with software vendors to manage SaaS, a sharp increase from last year
What practices have you implemented for managing Saas?

N=512
Source: Flexera 2026 State of ITAM Report
(Figure 25)
![]()
![]()
SaaS management practices are largely consistent with last year, with one notable practice increased by 14 percentage points year over year and is up 15 percentage points compared to two years ago, suggesting organizations are pushing for more value from their software vendors. Chargeback or showback is also a new category for the survey this year, with 23% of respondents reporting they use it for SaaS.
Organizations expect AI software investment to rise, and ITAM professionals anticipate their SAM focus will shift accordingly. Nearly half of respondents (47%) expect a significant increase in the attention paid to AI software over the coming years.
At the same time, respondents report lower expected focus in data center software (down 11 percentage points year over year), desktop software (down 4 points) and public cloud software licenses (down 7 points). Desktop and data center software also lead in reported decreased focus in the next three years. Overall, planned investment is down across most software categories outside of AI, which may reflect broader economic conditions and uncertainty about how AI will affect organizations.
For your SAM practice, how do you expect your focus on the following areas to change in the next 3 years?

N=512
Source: Flexera 2026 State of ITAM Report
(Figure 26)
![]()
![]()
What are the top 3 SAM initiatives you want to advance in the next year?

N=512
Source: Flexera 2026 State of ITAM Report
(Figure 27)
![]()
![]()
Optimizing software spend remains the top SAM priority, driven by license reuse, contract negotiation and rightsizing across on‑premises, SaaS and cloud software environments. It’s more than 19 percentage points ahead of the next-highest first-ranking priority, up more than 9 percentage points year over year. This is also the largest gap we’ve seen between the first and second priorities since we began the survey.
Overall, priorities point to a “save more, spend less” theme. Tracking AI usage debuted in the middle of the pack, and we’ll be watching how it shifts as AI programs mature.
Vendor snapshot
Microsoft remains the most relevant software vendor for many SAM programs, coming in with a 4.15 on a scale of 1 to 5. AI software is also rising in relevance as spend on AI grows.
How relevant are these software vendors to your SAM program?

N=512
Source: Flexera 2026 State of ITAM Report
(Figure 28)
![]()
![]()
How relevant are these SaaS vendors to your SAM program?

N=512
Source: Flexera 2026 State of ITAM Report
(Figure 29)
![]()
![]()
When it comes to the importance of SaaS vendors and technologies to SAM programs, Microsoft continues to be the most important vendor across all categories. Notably, AI software has increased sharply in investment importance, moving from the lowest-ranked area last year to nearly the third highest this year. Its weighted average rose from 1.94 to 3.13, suggesting AI will continue to take a larger share of SAM attention as adoption expands. SaaS vendors across the board were ranked more relevant this year compared to last year.
How relevant are these technologies to your SAM program?

N=512
Source: Flexera 2026 State of ITAM Report
(Figure 30)
![]()
![]()
Estimate the percentage of time ITAM teams spend on software responsibilities
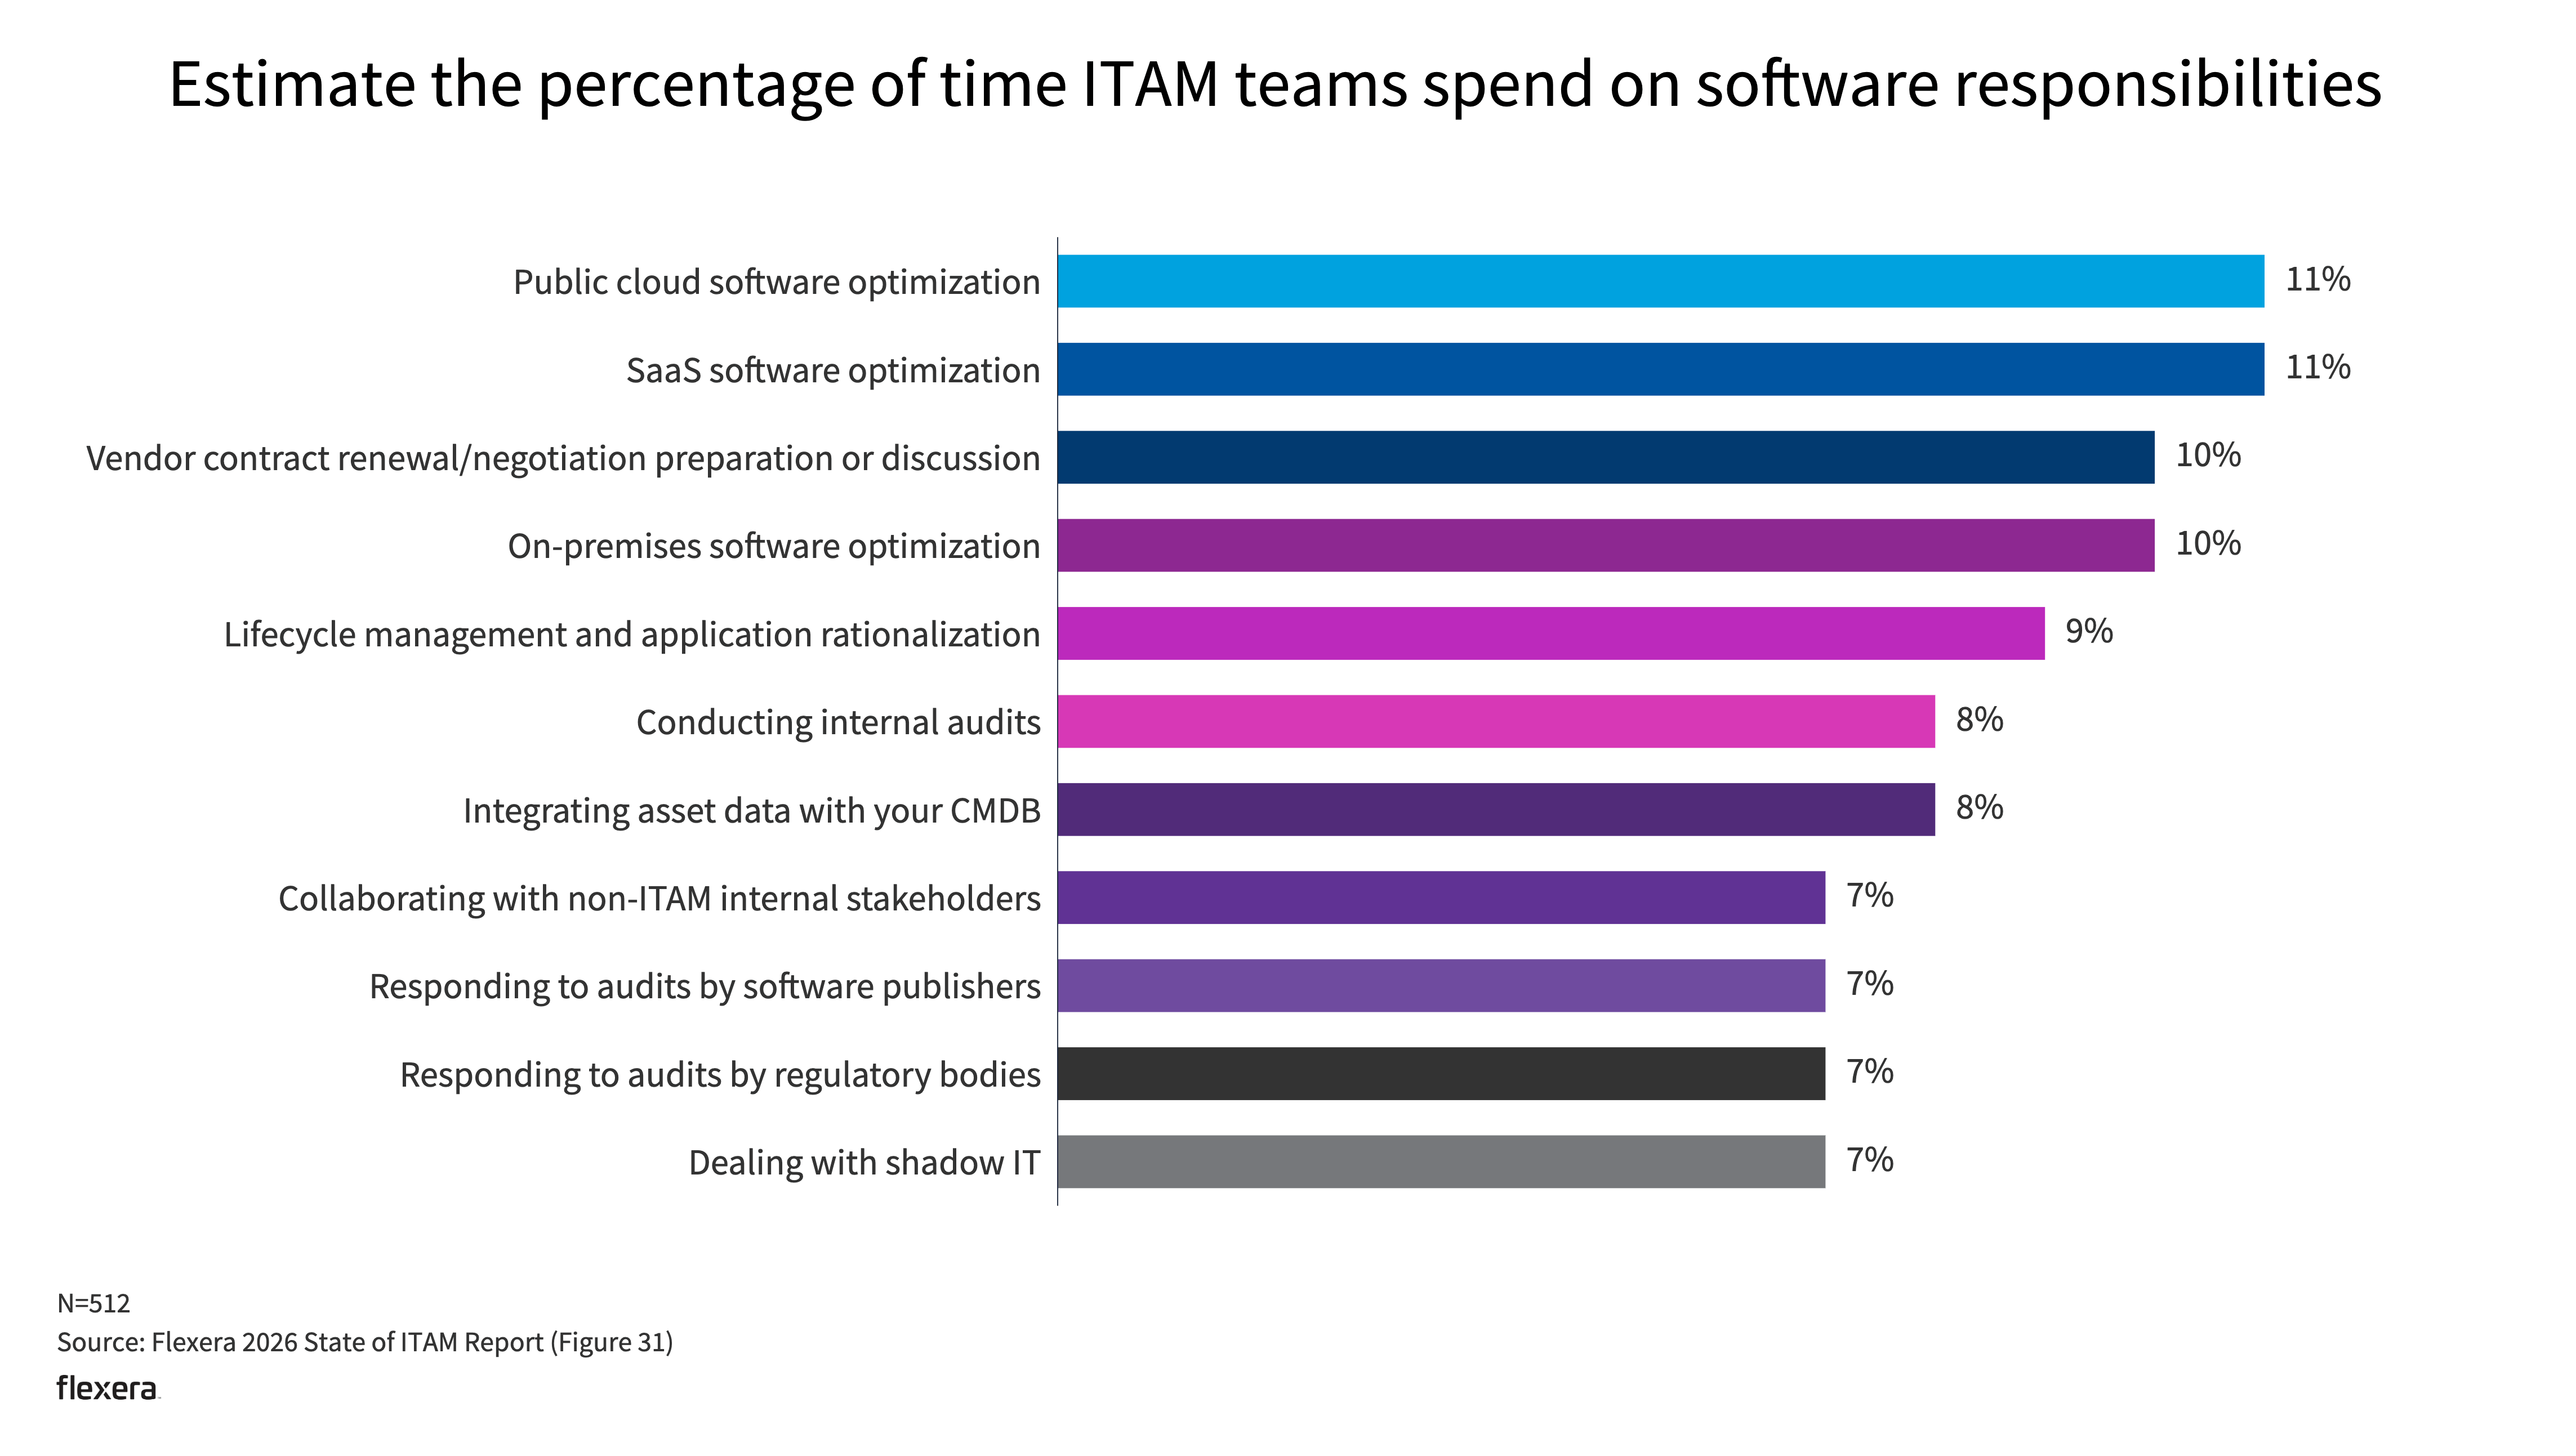
N=512
Source: Flexera 2026 State of ITAM Report
(Figure 31)
![]()
![]()
This year we’ve asked a new question to breakdown how ITAM teams are spending their time on SAM related activities. ITAM teams spend the most amount of time (11%) on both optimizing public cloud software and optimizing SaaS. Adding in on-premises optimization, we see that roughly a third of their time is spent on optimizing software.
When looking at hardware assets, ITAM teams spend the most time (37%) managing the lifecycle of hardware assets. And finally, ITAM teams spend 58% of their time doing SAM tasks compared to 42% of their time doing HAM tasks.
32% of ITAM teams' time is spent on software optimization vs. 22% on responding to or conducting audits
Estimate the percentage of time ITAM teams spend on hardware responsibilities

N=512
Source: Flexera 2026 State of ITAM Report
(Figure 32)
![]()
![]()
Estimate the percentage of ITAM teams’ time spent on hardware vs. software and SaaS-related responsibilities

N=512
Source: Flexera 2026 State of ITAM Report
(Figure 33)
![]()
![]()
Audit activity remains one of the most persistent drivers of ITAM effort and investment. This year’s findings look at both recent audit activity and longer‑term trends to show how audit pressure is shaping priorities, resourcing and optimization strategies.
Microsoft audits increased by 14 percentage points year over year and are the most commonly reported at 64%. Oracle also rose by 14 percentage points, while Adobe and VMware increased by 8 and 9 percentage points, respectively. These high numbers—and the increasing trend line—should be a concern for businesses.
Looking at reported audit costs over the past three years, the highest spend tiers declined this year (5% at $5 million to $10 million, 6% at $10 million to $25 million, and 2% at $25 million or more). At the same time, more respondents reported spend in the mid-range tiers (up 4 percentage points at $500k to $1 million and up 11 percentage points at $1 million to $2 million). Overall, audits remain prevalent, with 44% of organizations reporting more than $1 million in audit spend over the past three years. Tracking both to 1-year and 3-year audit activity provides a clearer picture of near‑term pressure and longer‑term financial impact.
Audit activity isn’t limited to the multi-year view. Nearly half of respondents (48%) say their organization received an audit in the past year. Among those respondents, 64% report a Microsoft audit and 50% report an Oracle audit.
64% of respondents say they’ve had an audit from Microsoft in the past year
Get help with software audits
Get startedWhich vendors have audited your organization in the past 3 years?

N=512
Source: Flexera 2026 State of ITAM Report
(Figure 34)
![]()
![]()
How much do you estimate your organization has spent on software vendor audits over the past 3 years?

N=512
Source: Flexera 2026 State of ITAM Report
(Figure 35)
![]()
![]()
Have you received notice or have you received a software audit in the last year?

N=512
Source: Flexera 2026 State of ITAM Report
(Figure 36)
![]()
![]()
Of those audited in the last year, which vendors have audited your organization?

N=245
Source: Flexera 2026 State of ITAM Report
(Figure 37)
![]()
![]()
Roughly half (51%) of companies annually spend more than $5 million on software running in the cloud and 29% of companies spend more than $15 million. Of that software, the majority of the spend is in three vendors: Microsoft, Oracle and SAP—with a huge bulk being Microsoft at 40%.
Estimate your organization’s annual spend on PAYG or BYOL software licenses that are running in the cloud

N=512
Source: Flexera 2026 State of ITAM Report
(Figure 38)
![]()
![]()
Of your organization’s annual PAYG/BYOL costs, what is the approximate breakdown for the following software vendors?

N=512
Source: Flexera 2026 State of ITAM Report
(Figure 39)
![]()
![]()
Where are you seeing the biggest impact in mitigating price increases for Microsoft?

N=512
Source: Flexera 2026 State of ITAM Report
(Figure 40)
![]()
![]()
Reducing the number of licenses and downgrading licenses are the top two ways companies are saving on Microsoft. For IBM, rightsizing virtual environments and utilizing sub-capacity licensing is the top way they’re saving. For ServiceNow, reducing licenses is by far the most effective strategy for companies in reducing costs. And finally, reducing the number of physical cores/hosts that run Oracle workloads is where companies are finding the most savings for Oracle. Across the board, rightsizing the business by reducing licenses is a key way companies are saving on software across vendors—ranked first for Microsoft and ServiceNow, second for Oracle and third for IBM.
Where are you seeing the biggest impact in mitigating price increases for IBM?

N=512
Source: Flexera 2026 State of ITAM Report
(Figure 41)
![]()
![]()
Where are you seeing the biggest impact in mitigating price increases for ServiceNow?

N=512
Source: Flexera 2026 State of ITAM Report
(Figure 42)
![]()
![]()
Where are you seeing the biggest impact in mitigating price increases for Oracle?

N=512
Source: Flexera 2026 State of ITAM Report
(Figure 43)
![]()
![]()
SAM and HAM
success metrics focus
on saving money
Overall, the metrics organizations use to gauge the success of their HAM initiatives were largely unchanged year over year. The main shift was a stronger focus on reducing manual effort, which increased to 41%—potentially reflecting growing interest in AI-driven automation.
For SAM initiatives, the top success metrics remain hard savings on software and compliance with regulatory audits, both of which continue to rank very high at 49%.
Compliance with vendor contracts dipped a few percentage points, but most categories are in line with last year.
New to the survey this year, 29% of respondents report adopting, tracking or measuring the value of AI software, and this metric is likely to rise as AI portfolios expand. We also saw a meaningful year-over-year gain in reducing growth on renewals, up 7 percentage points.
What metrics are used to measure the success of your HAM initiatives?

N=512
Source: Flexera 2026 State of ITAM Report
(Figure 44)
![]()
![]()
What metrics are used to measure the success of your SAM initiatives?

N=512
Source: Flexera 2026 State of ITAM Report
(Figure 45)
![]()
![]()
Savings patterns from organizations’ SAM programs remain consistent year over year, with license reuse continuing to deliver the most reliable gains. Organizations report significant savings by reusing licenses to avoid new purchases outside of cloud environments, with 43% identifying this as a key cost optimization strategy.
By maturity level, reusing licenses to avoid buying new licenses is producing savings across the board with 94% of advanced ITAM companies reporting savings. Strong negotiations also produce strong savings across the board. AI tools aren’t producing strong savings yet, but we plan to keep an eye on this trend line.
SAM teams help improve their organizations’ bottom line in two ways: cutting costs and staying audit ready
In what areas have you realized actual savings in the past year due to your SAM program?

N=512
Source: Flexera 2026 State of ITAM Report
(Figure 46)
![]()
![]()
SAM-generated savings by maturity level

N=512
Source: Flexera 2026 State of ITAM Report
(Figure 47)
![]()
![]()
48% of respondents are tracking usage and rightsizing their AI contracts
What practices have you implemented for managing AI software?

N=512
Source: Flexera 2026 State of ITAM Report
(Figure 48)
![]()
![]()
Almost half (48%) of surveyed organizations claim they’re tracking usage and rightsizing AI contracts, but when looking specifically at ITAM teams only 31% are claiming visibility into AI software. This discrepancy in visibility and action could lead to poor optimization of software or even audits.
This year saw meaningful gains in cloud, SaaS and BYOL visibility, likely reflecting closer collaboration between ITAM and FinOps teams. New this year, AI software visibility remains limited. Only 31% of organizations report having visibility into AI software, underscoring how early AI governance remains as ITAM teams begin operationalizing tracking and oversight for this emerging category. Visibility across AI is critical for businesses moving forward.
Do you have accurate visibility into the following environments within your IT estate?

2025: N=506; 2026: N=512
Source: Flexera 2026 State of ITAM Report
(Figure 49)
![]()
![]()
Does your organization have complete visibility into IT assets and their impact on business outcomes?

N=512
Source: Flexera 2026 State of ITAM Report
(Figure 50)
![]()
![]()
Organizations who reported complete visibility declined by 7 percentage points year over year, likely reflecting expanding scope, greater awareness of gaps and the growing presence of SaaS and AI outside traditional governance models.
Complete IT visibility declined to just 36% this year, a 7-percentage-point decrease
Role of CMDBs and
demand for greater
visibility into IT assets
32% of organizations report tracking AI applications as a data field in their CMDB
CMDB-based asset tracking increased slightly across most categories, with the largest year-over-year gain in private cloud storage volumes (up 7 percentage points). New this year, 32% of organizations report tracking AI applications as a data field in their CMDB.
When looking at organizations that export data from asset management tools into enterprise systems or CMDBs, Apptio shows a clear two-year upward trend in adoption among survey participants, up 8 percentage points year over year and 15 points compared to two years ago. Tanium also gained momentum (up 6 points year over year), while BMC declined by 8 points year over year.
What assets do you track in your CMDB?

N=512
Source: Flexera 2026 State of ITAM Report
(Figure 51)
![]()
![]()
Do you export data from your asset management tools into any of the following enterprise systems or CMDBs?

N=512
Source: Flexera 2026 State of ITAM Report
(Figure 52)
![]()
![]()
European
Spotlight
Europe shows a similar overall distribution to the global sample, with a higher share of respondents from organizations with 20,000 to 50,000 employees and a smaller share from organizations with 50,000 to 100,000 employees. The number of FTEs dedicated to HAM and SAM activities among European respondents closely mirrors the global results.
Size of European organizations

N=185
Source: Flexera 2026 State of ITAM Report
(Figure 53)
![]()
![]()
Number of FTEs devoted to HAM and SAM activities (European results)

N=185
Source: Flexera 2026 State of ITAM Report
(Figure 54)
![]()
![]()
52% of respondents in North America identify their SAM practices as intermediate when it comes to implementing SAM, compared to 48% of European respondents
North America moves back into the lead this year for respondents who describe their SAM practices as intermediate or advanced. Compared to last year, Europe has a slightly higher share of beginner programs (up 5 percentage points) and slightly lower shares of intermediate (down 4 points) and advanced programs (a decrease of 2 points).
Which statement best describes where you are in implementing SAM in your organization?

Europe: N=185; North America: N=290
Source: Flexera 2026 State of ITAM Report
(Figure 55)
![]()
![]()
Where European ITAM teams report in their organization

N=185
Source: Flexera 2026 State of ITAM Report
(Figure 56)
![]()
![]()
Compared to global results, European respondents are 7 percentage points more likely to report directly to the CIO or CTO (46%). The inverse pattern shows up in infrastructure management, where global respondents are 7 points more likely to report into infrastructure. Overall, the distribution is similar to last year, although reporting into infrastructure management increased slightly.
46% of European ITAM teams report directly to the CIO or CTO
78% of European and North American respondents have a FinOps team
Comparison of European and North American organizations that have a FinOps team

Europe: N=185; North America: N=290
Source: Flexera 2026 State of ITAM Report
(Figure 57)
![]()
![]()
Responses were consistent this year across the global, North American and European samples. Nearly 80% of organizations report having a FinOps team.
Additionally, interaction between European SAM and FinOps teams continues to tick up for European respondents, rising from 43% to 45%, while interaction between SAM and cloud teams remains strong at 52%.
European SAM teams that have significant interaction with other teams

N=185
Source: Flexera 2026 State of ITAM Report
(Figure 58)
![]()
![]()
SAM-focused responsibilities of European ITAM teams

N=185
Source: Flexera 2026 State of ITAM Report
(Figure 59)
![]()
![]()
Tracking AI software usage is new to the report this year: 43% of European respondents say they do it today, and 46% report it’s on their roadmap. It will be worth watching how this changes next year. Most other responses closely mirror the global results, with slightly lower software license tracking overall for European respondents (by less than 5 percentage points).
86% of European respondents say tracking and adopting AI is a challenge
European organizations’ challenges with SAM

N=185
Source: Flexera 2026 State of ITAM Report
(Figure 60)
![]()
![]()
European respondents’ biggest significant challenge is dealing with the complexity of software use rights. Adopting and tracking AI is creating challenges for 86% of European respondents, compared to 84% of global respondents.
Top 3 SAM initiatives European respondents want to advance in the next year

N=185
Source: Flexera 2026 State of ITAM Report
(Figure 61)
![]()
![]()
Optimizing software spend and driving savings continues to be the top SAM priority for European respondents. At the same time, tracking AI software usage is already the number one priority for 10% of European organizations looking ahead to next year.
In Europe, three metrics tied for the top spot this year when measuring the success of SAM initiatives: hard savings on software, cost avoidance and compliance with regulatory audits (50%). Notably, regulatory or internal audit compliance ranked 3 percentage points higher than compliance with vendor contracts. Adopting, tracking and measuring AI value is also new this year, with 25% of respondents reporting it as a success metric.
Half of European respondents say hard savings on software, cost avoidance and compliance with regulatory audits are used to measure SAM success
Metrics used by European respondents to measure the success of their SAM initiatives

N=185
Source: Flexera 2026 State of ITAM Report
(Figure 62)
![]()
![]()
Vendors that have audited European orgnizations in the past 3 years

N=185
Source: Flexera 2026 State of ITAM Report
(Figure 63)
![]()
![]()
Microsoft (62%) continues to be the top vendor auditor for European respondents, followed by SAP (43%) and Oracle (36%). Globally, IBM falls behind both SAP and Oracle.
Demographics
This year’s pool of respondents skews slightly toward larger organizations when compared to last year: 53% of organizations have more than 10,000 employees, and 16% have more than 50,000. Last year, those figures were 51% and 13%, respectively. There are slightly fewer organizations from the UK and Germany, but the number of Italian respondents increased year over year to 4%.
What size is your organization?

N=512
Source: Flexera 2026 State of ITAM Report
(Figure 64)
![]()
![]()
Where are your headquarters located?

N=512
Source: Flexera 2026 State of ITAM Report
(Figure 65)
![]()
![]()
What’s your company’s industry?

N=512
Source: Flexera 2026 State of ITAM Report
(Figure 66)
![]()
![]()
This year, representation increased in both financial services and healthcare, while tech software, retail and e-commerce and tech hosting declined. We also saw a slight uptick in C-level respondents, likely influenced by how several categories were split out this year. Cloud roles accounted for 19% of respondents, with another 4% coming from FinOps. Overall, the respondent role mix is very similar to last year and remains within our target distribution.
What best describes your function?

N=512
Source: Flexera 2026 State of ITAM Report
(Figure 67)
![]()
![]()
What’s your role?

N=512
Source: Flexera 2026 State of ITAM Report
(Figure 68)
![]()
![]()
Conclusion:
Positioning ITAM
for what’s ahead
ITAM continues to prove its value as a strategic discipline, even as the environments it governs become more complex. This year’s findings show steady progress in program maturity, stronger alignment with FinOps and cloud teams and a clear focus on optimization and cost control. At the same time, rising audit activity, evolving vendor use rights and growing AI adoption are testing the limits of traditional ITAM practices.
AI stands out as both an opportunity and a pressure point. Organizations are investing quickly, but visibility and governance lag behind adoption. As AI software becomes a permanent part of the IT estate, ITAM teams will play a critical role in bringing structure, accountability and financial discipline to this rapidly changing area—much as they’ve done for SaaS and cloud over the past decade.
Looking ahead, successful ITAM programs will be those that continue to modernize their tools, strengthen cross-functional collaboration, seek complete IT visibility and invest in accurate, actionable data. By doing so, organizations can reduce risk, control spend and make better decisions across their entire IT portfolio—even as complexity continues to rise.
Calculate the ROI for your ITAM efforts and see how to create measurable business value
About Flexera
Flexera helps organizations understand and maximize the value of their technology, saving billions of dollars in wasted spend. Powered by the Flexera Technology Intelligence Platform, our award-winning IT asset management, FinOps and SaaS management solutions provide comprehensive visibility and actionable insights on an organization’s entire IT ecosystem. This intelligence enables IT, finance, procurement and cloud teams to address skyrocketing costs, optimize spend, mitigate risk and identify opportunities to create positive business outcomes.
More than 50,000 global organizations rely on Flexera and its Technopedia reference library, the largest repository of technology asset data. Learn more at flexera.com.